

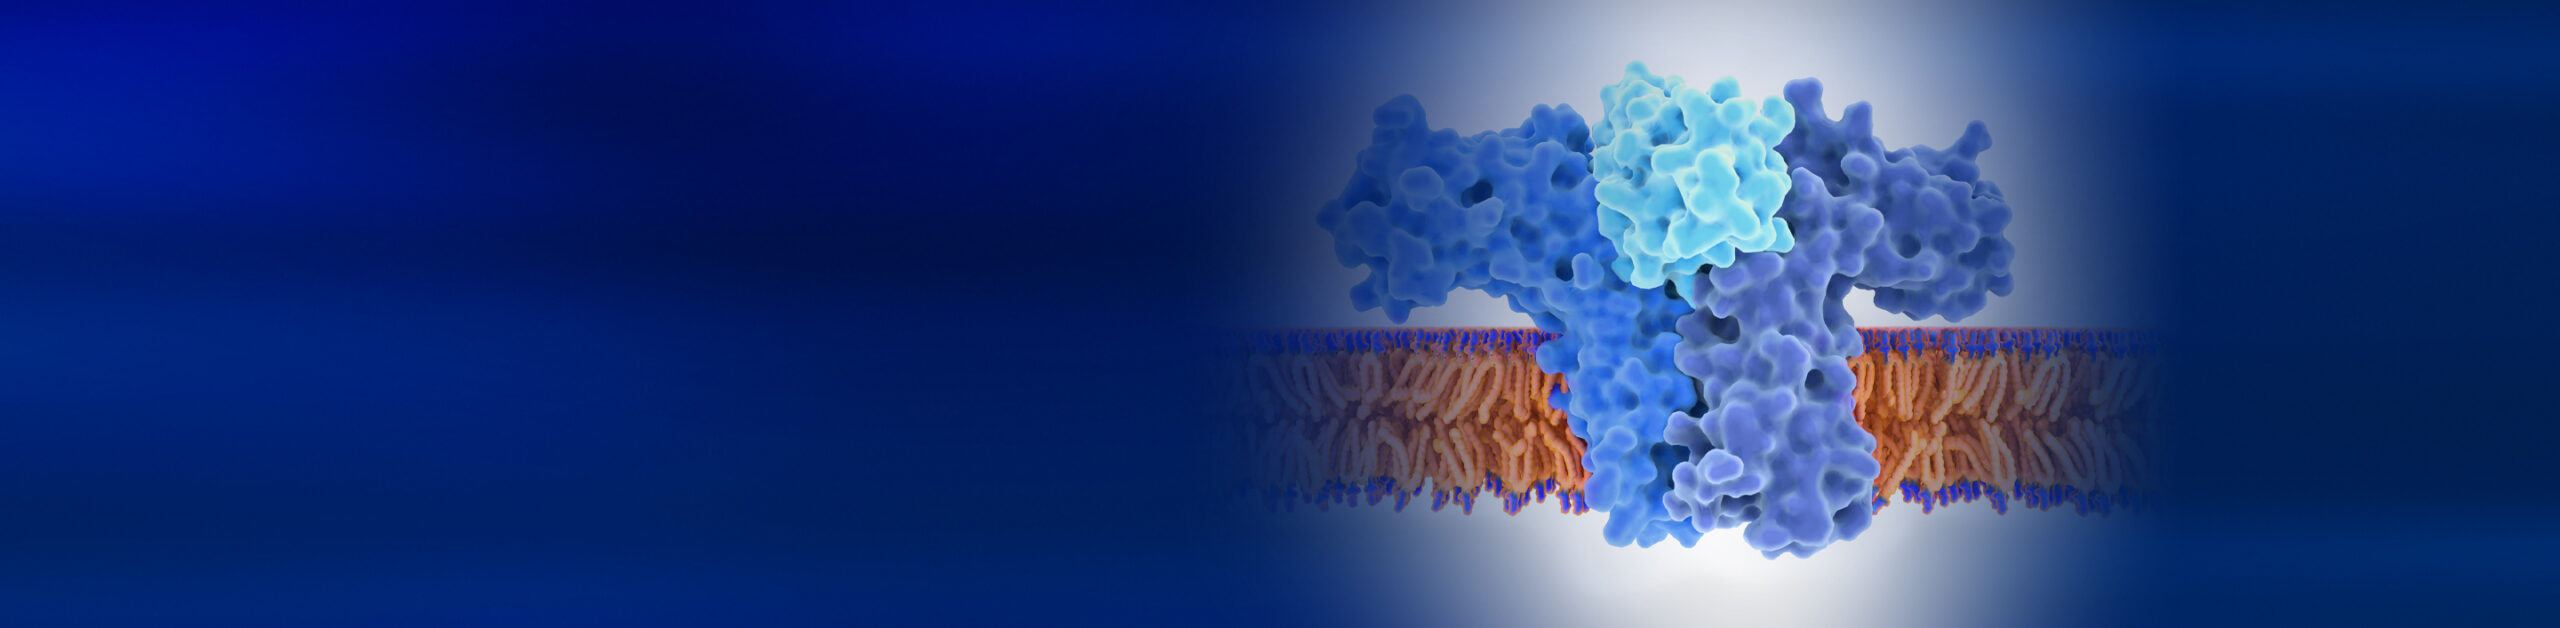
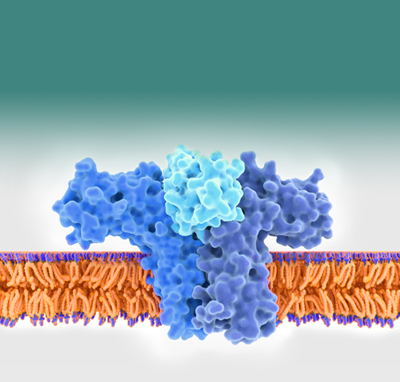
Accelerate the Development of Peptide Therapeutics for Obesity & Diabetes with MOA-Reflective Assays

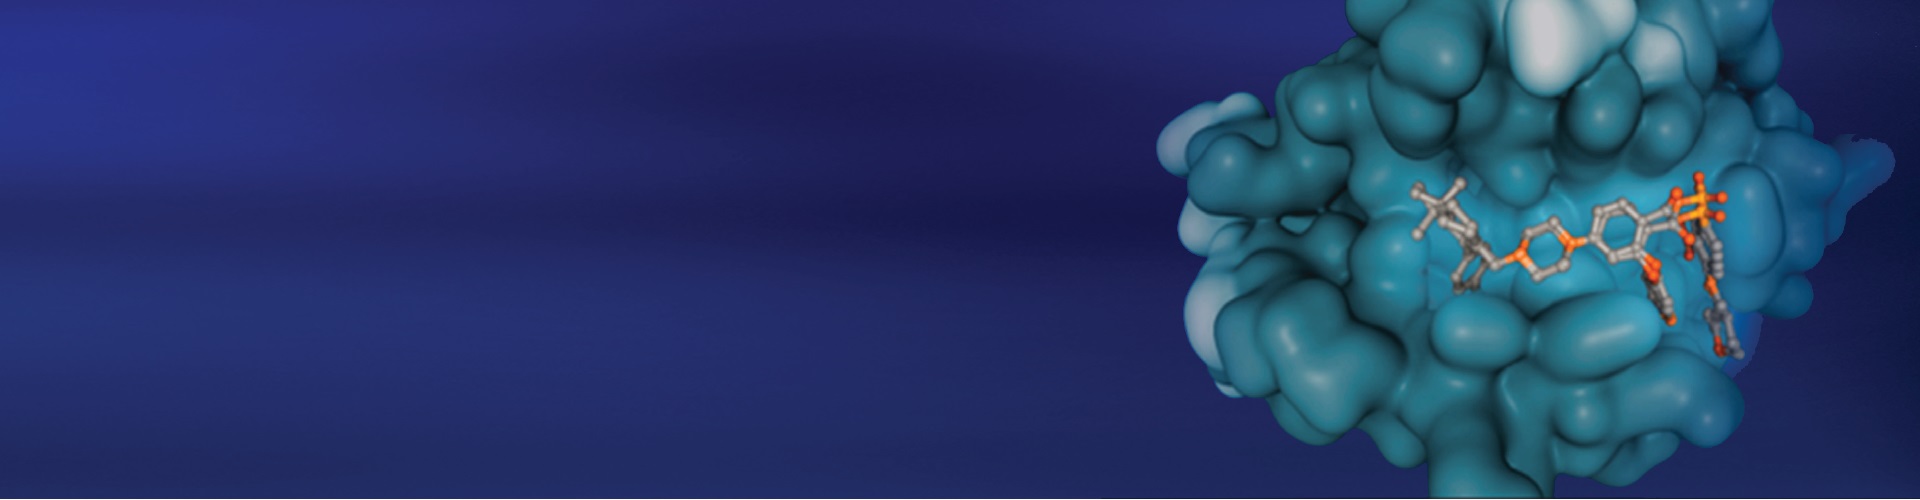
Convert Your Challenging ‘Undruggable’ Targets into ‘Druggable’ Targets
Screen & Rank Compounds for a Broad Range of Protein Targets using InCELL Target Engagement Cell-based Assays
Featured Products
NEW Obesity & Diabetes Product Solutions
Accelerate the Development of Peptide Therapeutics for Obesity & Diabetes with MOA-Reflective Assays
NEW PathHunter® IL-15 Bioassay Kit (Reporter)
Easily Determine Relative Potency of IL-15 Therapeutics
PrecisION® Ion Channel Cell Lines
High-quality, stable cell lines for target discovery, hit screening, lead optimization, & safety studies.
What’s New
Ion Channel Drug Discovery – Recent Advances in Novel Non-Opioid Pain Research
Join the webinar to learn about recently published research toward the advancement of non-opioid analgesics targeting the Nav1.8 ion channel, a validated pain target primarily found in peripheral nociceptors. About Webinar: Ion Channels Ion channels represent a key target class for therapeutic development in numerous diseases including epilepsy, cystic fibrosis, movement disorders, cardiac arrhythmias, renal […]